
U.S. Housing Markets Continue to Stabilize

Best Annual Improvement Since 2005

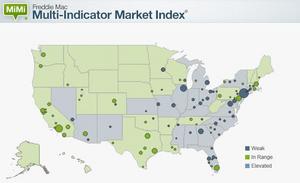
MCLEAN, VA--(Marketwired - Sep 23, 2015) - Freddie Mac (OTCQBFMCC) today released its updated Multi-Indicator Market Index® (MiMi®) showing the U.S. housing market continuing to slowly stabilize with one additional state, Rhode Island, and four additional metro areas entering their outer range of stable housing activity: Philadelphia and Harrisburg, Pennsylvania; Phoenix, Arizona; and Albany, New York. 
The national MiMi value stands at 81, indicating a housing market that is on its outer range of stable housing activity, while showing an improvement of +0.93% from June to July and a three-month improvement of +2.99%. On a year-over-year basis, the national MiMi value has improved +6.17%. Since its all-time low in October 2010, the national MiMi has rebounded 37%, but remains significantly off from its high of 121.7. 
News Facts:
  • Twenty-nine of the 50 states plus the District of Columbia have MiMi values in a stable range, with the District of Columbia (103), North Dakota (97), Montana (93.7), Hawaii (93.5), and California and Utah tied at (90) and ranking in the top five.
  • Forty-six of the 100 metro areas have MiMi values in a stable range, with Fresno (98.9), Austin (96.4), Honolulu (94.1), and Salt Lake City and Los Angeles tied at (92.9) and ranking in the top five.
  • The most improving states month-over-month were Florida (+2.00%), Colorado (+1.99%), New Jersey (+1.83%), Connecticut (+1.80%) and Nevada (+1.48%). On a year-over-year basis, the most improving states were Florida (+14.35%), Oregon (+13.45%), Nevada (12.18%), Colorado (+11.65%), and Washington (+10.18%).
  • The most improving metro areas month-over-month were Orlando, FL (+2.60%), Greenville, SC (+2.55%), Cape Coral, FL (+2.51%), Tampa, FL (+2.19%) and Jacksonville, FL (+2.12%). On a year-over-year basis, the most improving metro areas were Orlando, FL (+18.27%), Cape Coral, FL (+17.75%), Tampa, FL (+15.99%), Palm Bay, FL (+14.98%) and North Port, FL (+14.77%).
  • In July, 49 of the 50 states and all of the top 100 metros were showing an improving three month trend. The same time last year, 20 of the 50 states plus the District of Columbia, and 59 of the top 100 metro areas were showing an improving three-month trend. 
Quote attributable to Freddie Mac Deputy Chief Economist Len Kiefer:
"Nationally, all MiMi indicators are heading in the right direction for the second consecutive month and improving more than 6 percent from the same time last year. Florida has some of the most improving housing markets in the country, largely a reflection of more borrowers becoming current on their mortgage payments as the local employment picture improves and house prices rebound. The one area of the country that has been slow to respond has been the Northeast. However, we've started to see these housing markets turn around, especially in Pennsylvania, Connecticut, New Hampshire, Vermont and Maine. While many of the locals markets in the Northeast are still weak, they're steadily trending in the right direction and their pace of improvement is accelerating. Overall, the West remains especially strong, with many markets posting double-digit growth in their MiMi purchase applications indicator compared to a year ago and helping to keep the country on pace for the best year of home sales since 2007."
The 2015 MiMi release calendar is available online. 
MiMi monitors and measures the stability of the nation's housing market, as well as the housing markets of all 50 states, the District of Columbia, and the top 100 metro markets. MiMi combines proprietary Freddie Mac data with current local market data to assess where each single-family housing market is relative to its own long-term stable range by looking at home purchase applications, payment-to-income ratios (changes in home purchasing power based on house prices, mortgage rates and household income), proportion of on-time mortgage payments in each market, and the local employment picture. The four indicators are combined to create a composite MiMi value for each market. Monthly, MiMi uses this data to show, at a glance, where each market stands relative to its own stable range of housing activity. MiMi also indicates how each market is trending, whether it is moving closer to, or further away from, its stable range. A market can fall outside its stable range by being too weak to generate enough demand for a well-balanced housing market or by overheating to an unsustainable level of activity.
For more detail on MiMi see the FAQs. The most current version can be found at FreddieMac.com/mimi
Freddie Mac was established by Congress in 1970 to provide liquidity, stability and affordability to the nation's residential mortgage markets. Freddie Mac supports communities across the nation by providing mortgage capital to lenders. Today Freddie Mac is making home possible for approximately one in four home borrowers and is one of the largest sources of financing for multifamily housing. Additional information is available at FreddieMac.com, Twitter @FreddieMac and Freddie Mac's blog FreddieMac.com/blog.

Comments

Popular posts from this blog

Some home shoppers are calling it quits, convinced that prices have peaked

Two years ago, Mike Saavedra moved to Southern California, equipped with a new high-paying healthcare job and a plan. The former Arizona resident would rent by the beach while becoming familiar with neighborhoods where he may want to purchase a house. But a few months after starting his search, the Manhattan Beach renter cut it off. It was, he decided, the wrong time to buy. “I definitely think home prices are slightly overinflated,” Saavedra, 48, said. And he thinks there’s a good chance they’ll fall. “I would kind of like to wait and see if that happens.” After nearly seven years of sometimes fevered price hikes, the Southern California housing market has  slowed markedly  in recent months. Sales have fallen from year-ago levels and price appreciation has shrunk. In Los Angeles and Orange counties, year-over-year price increases peaked at 8.2% in April and have declined every month since. In October, home prices in those counties rose 5.5% over th

Most Expensive U.S. Home Sale Ever: Billionaire Ken Griffin Closes On $238 Million New York Penthouse

A Manhattan penthouse is now the most expensive home ever sold in the United States. Hedge fund billionaire Ken   Griffin closed on an apartment under construction at 220 Central Park South this week for around $238 million. A spokeswoman for Griffin confirmed the sale, which was originally reported by Wall Street Jurnal  The deed is not yet available in city property records.  The figure destroys the previous New York City record of $100.47 million set in 2014; Computer billionaire Michael Dell was recently exposed as the owner of that penthouse in nearby ONE57. The prior national record was also set that same year when Barry Rosenstein, another hedge fund billionaire, purchased an East Hampton spread for $147 M. Since then, nine-figure sales have been largely concentrated in and around Los Angeles.  However, Griffin, with a net worth of $9.9 billion, is no stranger to massive real estate purchases. Just this week it came out that he spent $122 million on a London home    close

Los Angeles, Orange County home price gains smallest in 6 years

Two new home price indexes provide further evidence Southern California home prices are softening amid slower sales and rising inventory. The S&P/CoreLogic Case-Shiller Home Price Index released Tuesday, Jan. 29, shows house prices were up 4.4 percent year over year in November in Los Angeles and Orange counties. That’s the smallest gain since September 2012. Meanwhile, the separate and more comprehensive CoreLogic Home Price Index released earlier this month showed house prices up 5.2 percent from year-ago levels in Los Angeles County and the Inland Empire. House prices rose 3.3 percent in Orange County. Those are the smallest gains in L.A. and Orange counties since the summer of 2012 and the smallest gain in the Inland Empire since the summer of 2015. Case-Shiller figures show appreciation is falling in the nation as a whole as well. The firm’s National Home Price Index showed U.S. home prices up 5.2 percent in November – the eighth consecutive month of slowing home